
In this post we will take a look at data from the INGICS iGS01RG beacon.
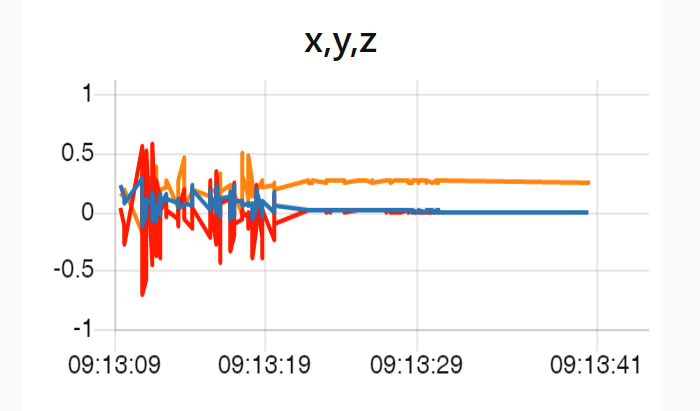
The x axis is time. You can see the x, y and z values, every 100ms, over time. The y axis is normalised between -1 and -1 for use in our SensorCognition Edge device. The chart is for when the beacon has been moving, followed by a stationary period. Notice how the orange line continues to show acceleration even though the beacon isn’t moving. This is caused by gravity.
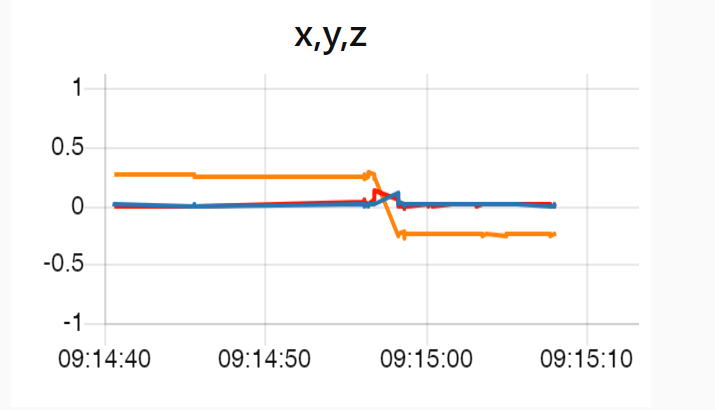
In this chart the beacon has been flipped over and the orange line now shows a constant negative acceleration.
A good thing about the presence of a constant offset in one of the x y z inputs is that it can be used to help determine the orientation of the beacon. The less desirable aspect is that the offset significantly complicates using the x y z to determine types of movement such as human gestures.
Such complex data problems are more easily solved using AI machine learning than trying to write a traditional algorithm to make sense of the data.
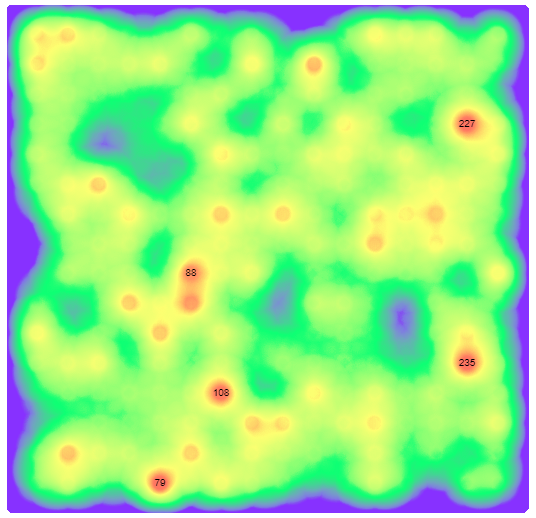
Here’s an example of output from a SensorCognition Edge device trained with up and down movement and left and right movement. In this case, the output 227 is showing the beacon is moving left and right.
Read about SensorCognition