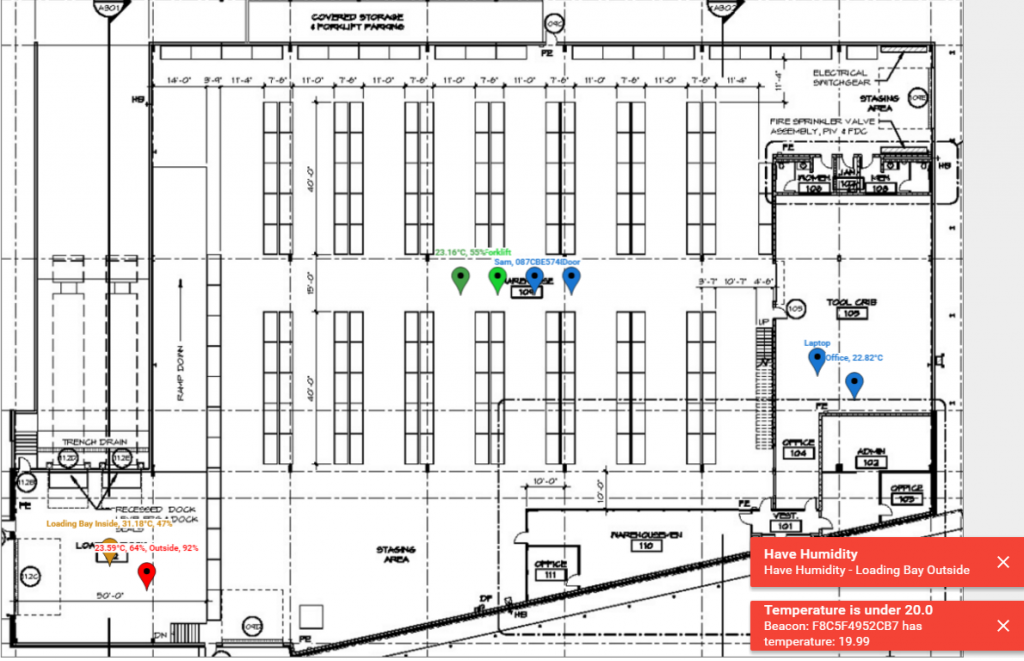
BeaconRTLS™ has a myriad of uses across logistics, manufacturing, healthcare and facilities management. It tracks assets and people to locate them in real time and detect anomalies to improve operational efficiency. This also extends to IoT sensing using sensor beacons that measure temperature, humidity, movement, light, proximity and open/closed.

The system allows you to search for and map the location of beacons. You can set up screen and email alerts based on asset type, location and sensor data. But what if you need more than this?
BeaconRTLS™ stores historical information which provides for industry or scenario specific reporting. For example, recent customers have been asking for Covid specific reports such as room occupancy and who has been in the same room at the same time.
The BeaconRTLS™ API allows your systems or reporting systems to access the data. However, this is of less use for those who want to implement solutions quickly and easily. The tricky part is that we have found every customer tends to need different reporting. Up until now we have been creating ad-hoc reports on a case by case basis.
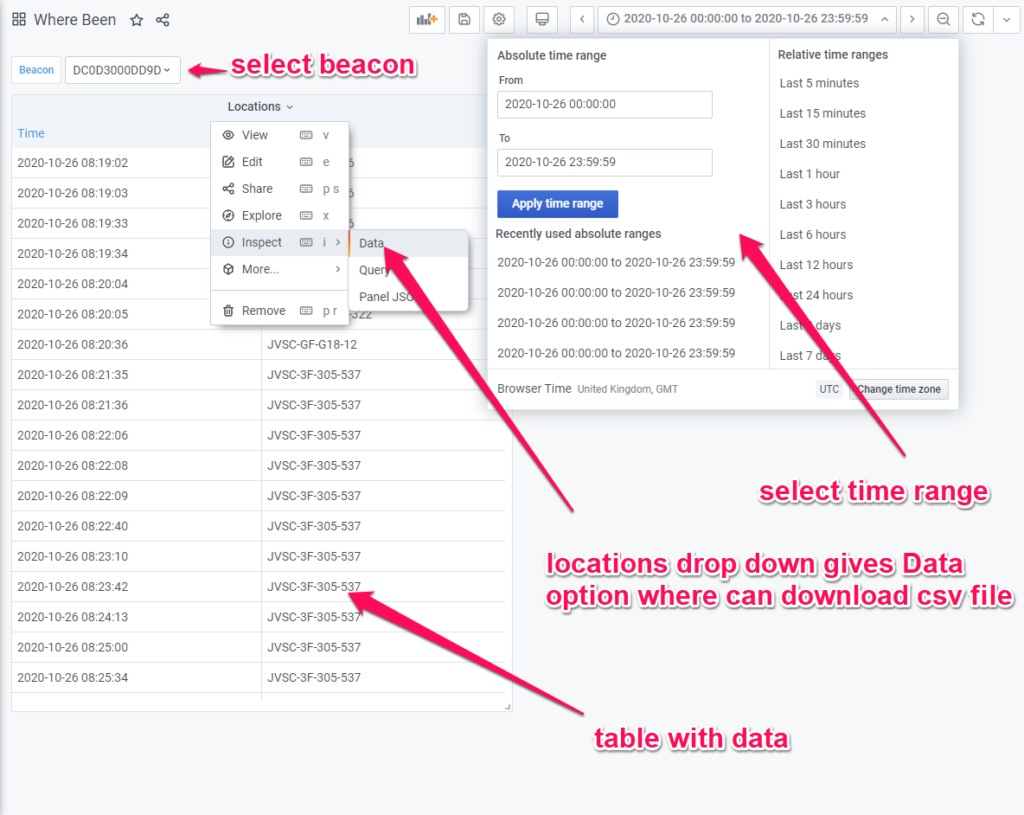
We have been looking to standardise how custom reports are created with BeaconRTLS™ to reduce effort, time and cost and allow more customers to create reports for themselves. To enable this we have integrated BeaconRTLS™ with Grafana.
Grafana is a free, commonly used open source platform that allows you to show data in custom ways using dashboards and panels. We are creating example Grafana reports for use with BeaconRTLS™ that our customers can use directly or modify for their own use.

Contact us if you are interested in using BeaconRTLS™ and would like to take part in the pilot of BeaconRTLS™ with Grafana.